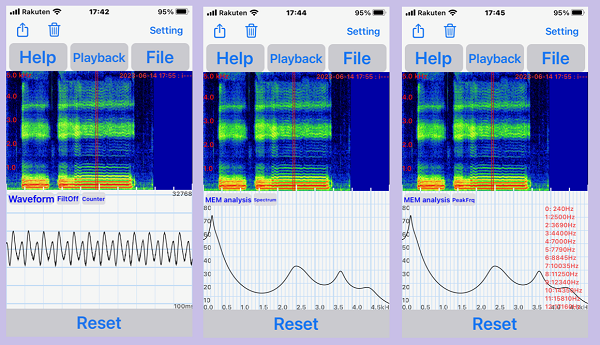
Spectrum by autoregressive model (MEM method)
This is a spectral estimation using Burg's Maximum Entropy Method (MEM).
High frequency resolution, even for a short data segement, making it suitable for peak frequency estimation.
However, this method has the problem that the result of spectral estimation depends on the order of calculation.
In this application, the calculation order is set in the range of 5 to 50. This application displays spectral
estimates at the order with the lowest FPE.
Tap the Waveform button five times on the analysis screen to enter this mode
and display the spectrum.
The curve is close to the envelope of the FFT spectrum obtained by cepstrum analysis.
Tap the Spectrum button on the right side of MEM analysis button to display
the detected peak frequencies.