Spectrum by FFT
Observation of Spectrum by FFT
The spectrum from the FFT of the selected segment in Waveform mode is displayed.
The figure below shows the results of drum-type washing machine noise measurements. For such stable sounds,
selecting a long interval in Waveform mode will result in more accurate results,
since the average value is calculated for that period. The FFT is performed with 4096 points and the window function
is a Hanning window, shifting by 20 msec. The average spectrum of the displayed interval is calculated and then
logarithmically transformed to dB value. If the filter is turned on in Waveform mode, the spectrum of the
filtered waveform is displayed as a red line (except for the FFT filter) in addition to the spectrum of
the original sound as a black line.
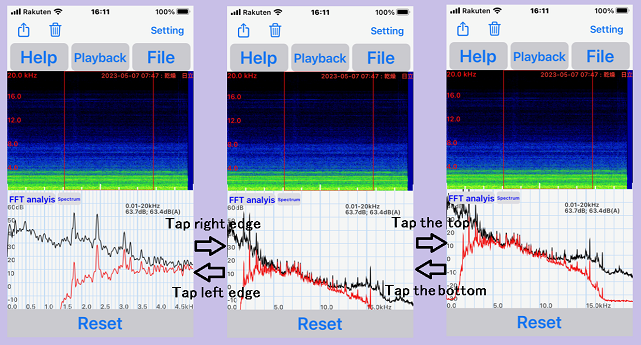
Screen Operation: Tap the right edge to expand the frequency display range (highest is 0-20 kHz),
and tap the left edge to narrow the frequency display range (lowest is 0-500 Hz). Tap the top of the graph
to move up, and tap the bottom of the graph to move down.
In the example below, LPF (10 kHz) and HPF (5 kHz) are applied in Waveform mode,
so the red line shows attenuation in the bands other than 5-10 kHz.
In the upper right corner of the FFT graph screen, the average sound pressure level in the displayed interval is
shown without and with (A) auditory correction.
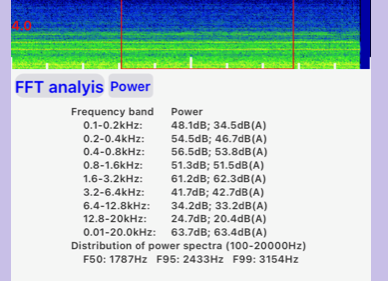
Pressing the Spectrum button will enter Power display mode and the power by
bandwidth will be displayed in both without hearing correction (dB) and with hearing correction (dB(A)).
F50, F95, and F99 indicate the frequencies where the power added from the low frequency (100Hz) accounts for 50%, 95%, and 99% of the total power, respectively,
in the frequency range (above 100Hz) of the FFT spectrum graph display. This variable is used in
breath sounds analysis, etc. These indicators are not affected by the filter in Waveform mode.